Executive Summary
This technical review provides a comprehensive overview of data quality management in mineral exploration drilling for mining industry professionals. The article synthesizes key concepts from sampling theory, QAQC procedures, geological logging, and domain modeling to support accurate resource estimation. With exploration drilling representing significant capital investment and forming the foundation for all downstream decisions, ensuring data quality from the outset is critical. This review emphasizes that project quality is fundamentally a function of data quality, following the principle of “garbage in, garbage out.”
1. Introduction to Data Quality in Mineral Exploration Drilling
Data quality forms the cornerstone of successful mineral exploration and resource estimation. In mining, critical decisions involving millions of dollars are made based on minuscule sample sizes representing less than 0.0001% of the total orebody. This reality makes data quality paramount to project success. The Preparation phase of resource estimation focuses on ensuring the quality and integrity of data used for all subsequent decisions. Without proper checks and validation, projects face two significant risks: making decisions based on false data or being unable to extract valuable insights due to constant doubt about data integrity.
Resource classification codes such as SNI, JORC, SAMREC, and NI 43-101 demand meticulous attention to data collection, representativity, and database integrity. Data collection forms the bedrock for all subsequent decisions, yet its integrity is often overlooked until a project becomes commercially interesting. A positive QAQC program serves as a “stamp of approval” for the database, providing confidence in geological interpretations, mathematical estimations, and resource classifications.
Practical Recommendations:
- Implement QAQC from day one of drilling, not after data collection is complete
- Establish clear data collection protocols before mobilizing to site
- Maintain a centralized database with built-in validation checks
- Review QAQC results in real-time to identify problems immediately
- Budget 5-10% of analytical costs for quality control samples
- Train field personnel on data quality importance and protocols
- Document drilling conditions, sample handling, and deviations
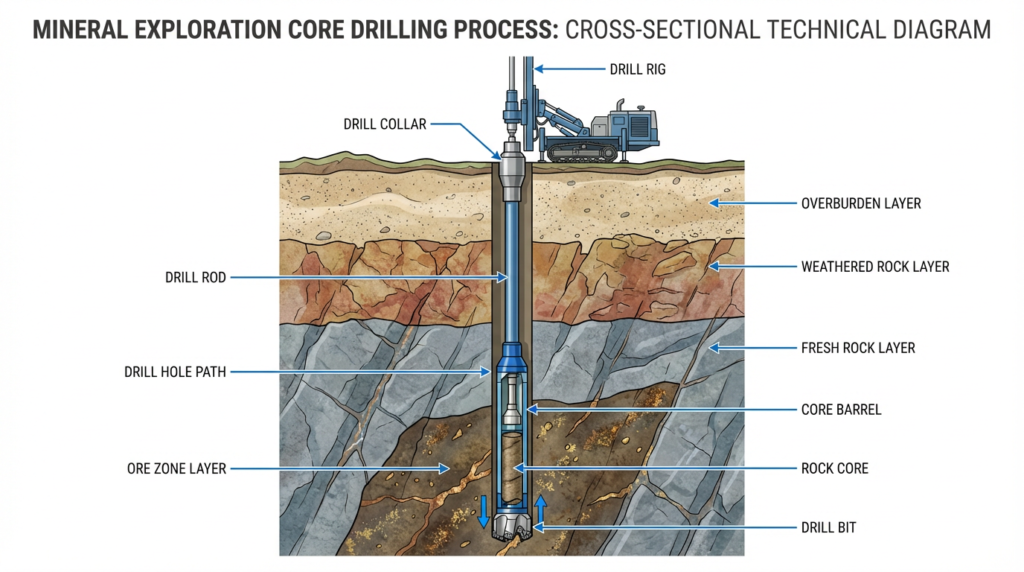
2. Core Drilling Methods and Drillhole Planning
Core drilling is the primary method for obtaining subsurface geological information in mineral exploration. Diamond core drilling uses a rotating drill bit embedded with industrial diamonds to cut a cylindrical core of rock, which is retrieved to surface for logging and sampling. The quality of core recovery and sample representativeness depend heavily on proper drilling methods and careful drillhole planning.
Drillhole planning determines the effectiveness and efficiency of exploration programs. Proper planning considers the geological model, target geometry, required data density, drilling method, core size, and budget constraints. Drillholes should be oriented to intersect mineralization at optimal angles, typically perpendicular or near perpendicular to the interpreted strike and dip.
Core size selection depends on intended use. Common sizes include NQ (47.6 mm), HQ (63.5 mm), and PQ (85.0 mm). For most exploration programs, HQ core provides a good balance between sample volume and cost. Drillhole spacing is determined by geological complexity and grade variability. Initial reconnaissance drilling may use wide spacing (200-400 m), while infill drilling progressively reduces spacing to increase confidence.
Core recovery is the percentage of the drilled interval actually recovered to surface. Low core recovery can introduce significant bias, particularly if mineralized zones are preferentially lost. Target core recovery should be greater than 95% in competent rock and greater than 85% in fractured zones.
Practical Recommendations:
- Develop a geological model before drilling to guide drillhole placement
- Orient drillholes perpendicular to mineralization
- Use HQ core as standard for most exploration programs
- Specify core recovery requirements in drilling contracts
- Use downhole surveying at regular intervals (every 30-50 m)
- Plan for contingencies including additional drillholes
- Document drilling conditions and difficulties encountered
- Optimize drillhole spacing using geostatistical analysis
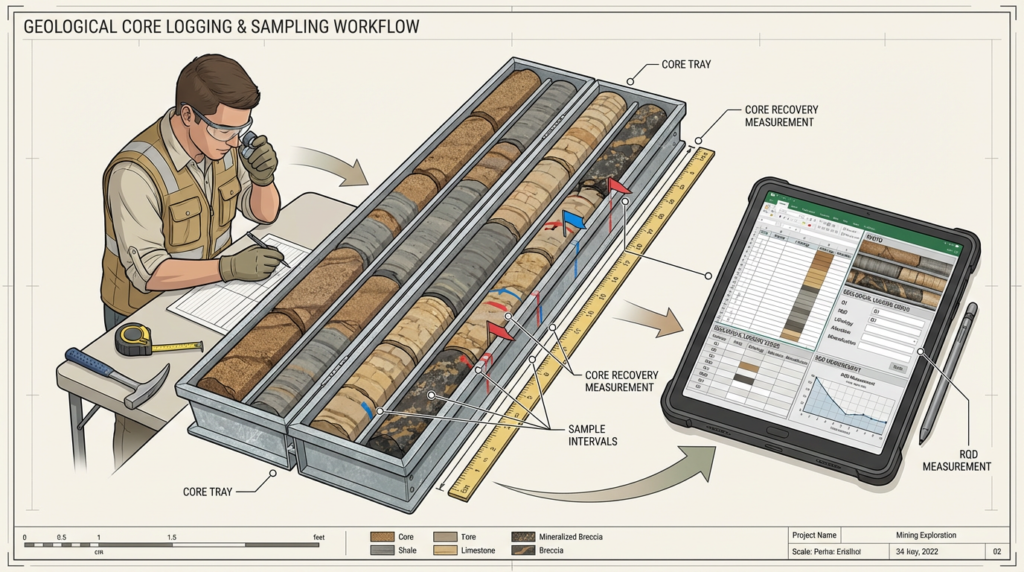
3. Geological Logging and Core Recovery
Geological logging is the systematic description and recording of rock types, structures, alteration, and mineralization observed in drill core. High-quality geological logging is essential for building accurate geological models, defining mineralization domains, and supporting resource estimation. Logging should be conducted by experienced geologists who understand the deposit type and geological setting.
The geological logging workflow begins with core reception and orientation. Core is delivered in core boxes, with each box labeled with drillhole number, depth interval, and box number. Core should be oriented using downhole orientation tools where possible. The core is then cleaned, measured for recovery, and photographed before logging begins. Digital photography provides a permanent record.
Logging protocols should be standardized across the project to ensure consistency. A logging legend defines the categories and codes used for lithology, alteration, mineralization, and structure. Quantitative logging methods should be calibrated between geologists to minimize subjective bias.
Core sampling follows geological logging. Sample intervals should respect geological boundaries, with separate samples for different rock types or alteration zones. Sample length is typically standardized (1-2 m) but may vary to honor geological contacts. The core is split using a diamond saw, with half sent for assay and half retained.
Practical Recommendations:
- Standardize logging protocols with a project-specific logging manual
- Train and calibrate geologists regularly for consistency
- Photograph all core before sampling
- Measure core recovery accurately for each drillhole run
- Orient core using downhole orientation tools
- Log at appropriate scale (typically 1:50 or 1:100)
- Record RQD and geotechnical data for mine planning
- Respect geological boundaries in sampling
- Maintain chain of custody for all samples
- Store core properly in secure facility
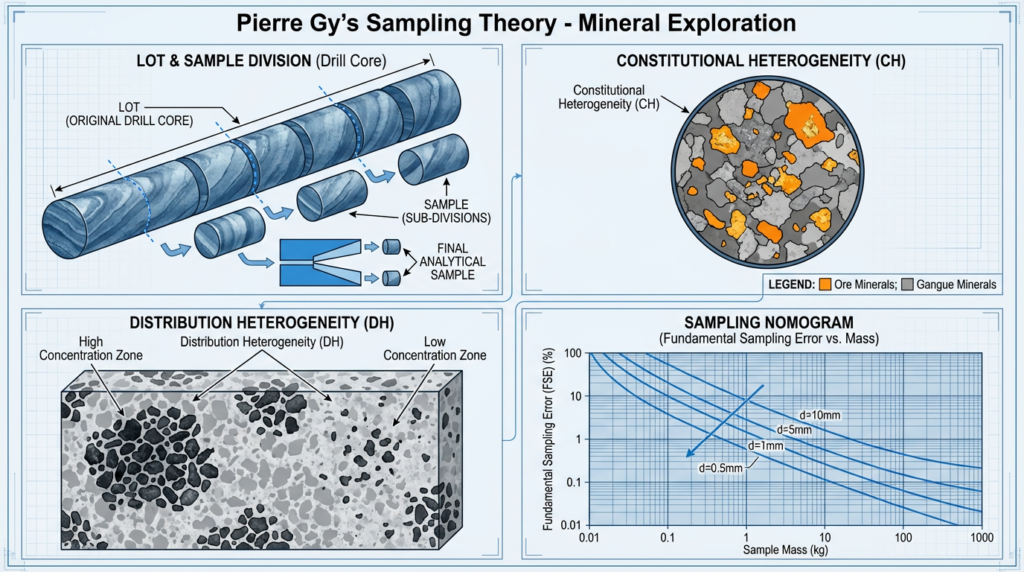
4. Sampling Theory and Sampling Errors (Pierre Gy’s Framework)
Sampling theory provides the scientific foundation for understanding and minimizing errors in the sampling process. Pierre Gy’s sampling theory identifies seven types of sampling errors and provides mathematical frameworks for quantifying and managing these errors. The fundamental principle is that a sample must be representative of the population it is intended to characterize.
Two types of heterogeneity affect representativeness: constitutional heterogeneity (internal variation of fragments) and distribution heterogeneity (spatial distribution of fragments). Both types influence sample grades and must be managed through proper sampling protocols.
Precision describes the reproducibility of measurements, quantified by comparing repeat samples. Accuracy describes how well the average of repeat samples targets the true grade. Bias is the systematic difference between the sample average and the true grade.
Pierre Gy’s Seven Sampling Errors include: Fundamental Sampling Error (FSE), Grouping and Segregation Error, Long-range Heterogeneity Error, Periodic Heterogeneity Error, Increment Delimitation Error, Increment Extraction Error, and Preparation Error.
The Fundamental Sampling Error (FSE) is the most important error. It describes the precision loss due to the physical composition and structure of the material. The FSE equation is: σ²_FSE = f × g × d³ × c × l × (1/M_S – 1/M_L), where f is the shape factor, g is the granulometric factor, d is particle size, c is the mineralogical factor, l is the liberation factor, M_S is sample mass, and M_L is lot mass.
The FSE equation reveals that FSE increases with the cube of particle size, meaning coarse material requires much larger samples. Sampling nomograms use these principles to design optimal crushing and splitting protocols.
Grouping and Segregation Errors occur when particles separate based on density, size, or shape during sample handling. These errors cannot be corrected later, making prevention critical through homogenization and careful sample handling.
Practical Recommendations:
- Use sampling nomograms to guide crushing and splitting protocols
- Minimize particle size by crushing to 90% passing 2-3 mm
- Take adequate sample mass, typically 2-5 kg for crushed samples
- Homogenize before splitting to minimize segregation errors
- Use appropriate splitting equipment such as riffle splitters
- Take multiple increments across the entire lot
- Minimize sample handling to reduce segregation opportunities
- Document particle size at each preparation stage
- Avoid contamination using clean equipment
- Test sampling protocols through duplicate sampling studies
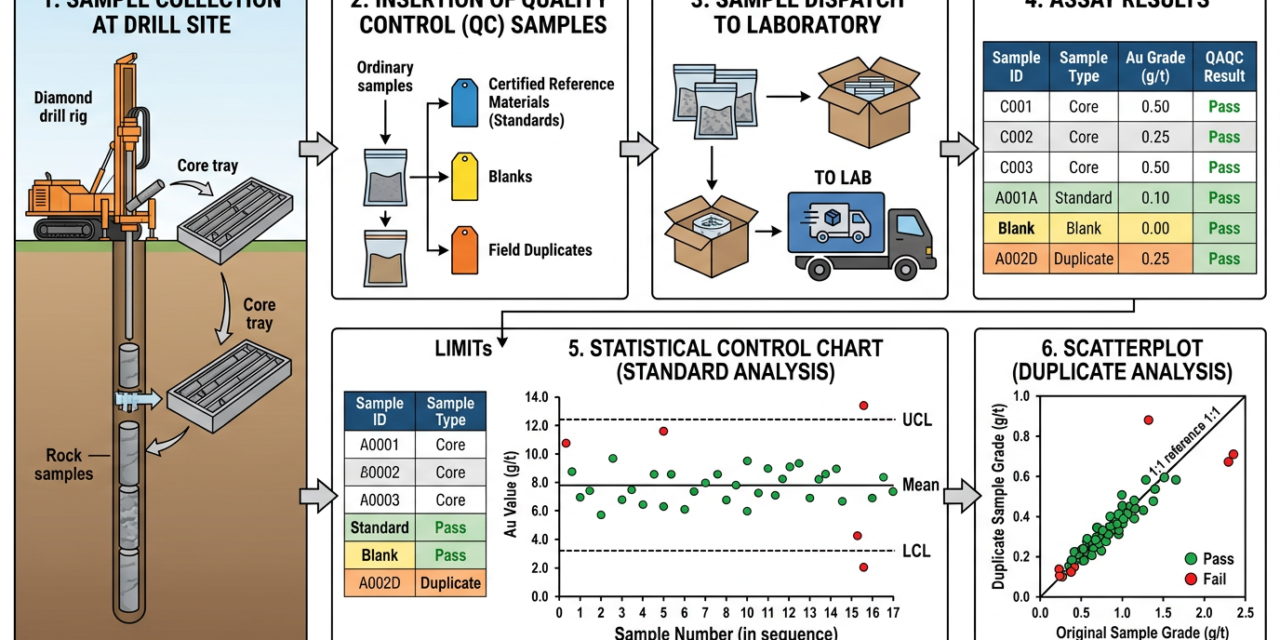
5. QAQC Procedures: Standards, Blanks, and Duplicates
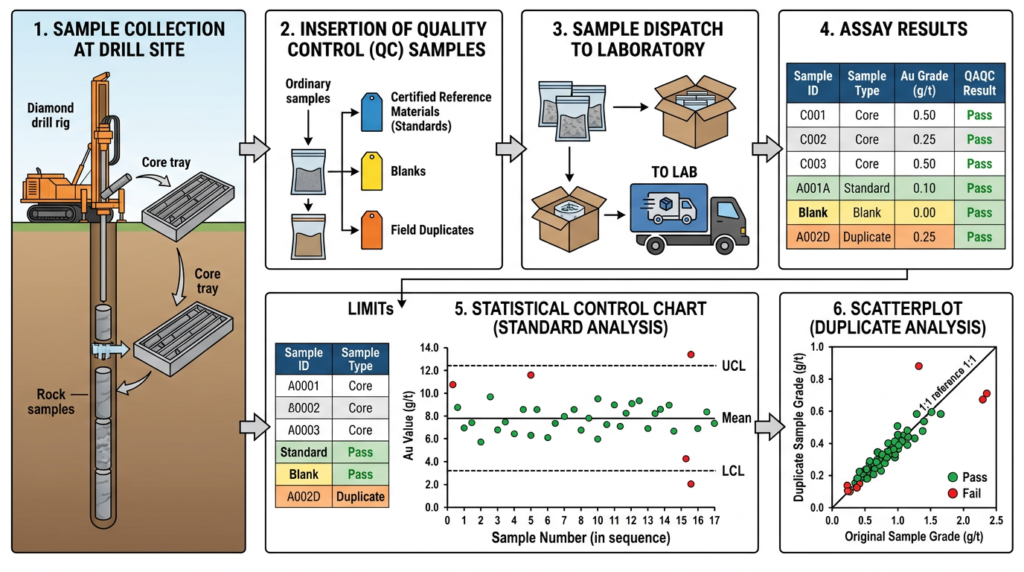
Quality Assurance and Quality Control (QAQC) procedures are essential for ensuring the reliability of analytical data used in resource estimation. QAQC involves inserting control samples (standards, blanks, and duplicates) into the sample stream at regular intervals and using statistical analysis to monitor analytical performance.
Certified Reference Materials (CRMs), commonly called standards, are samples with known grade values certified by independent laboratories. Standards are inserted to monitor analytical accuracy and detect bias. Multiple standards spanning the expected grade range should be used. The insertion rate is typically 5-10% of samples. Returned values should match certified values within acceptable limits, typically ±10% for base metals and ±5% for precious metals.
Blank samples are barren material inserted to detect contamination in the analytical process. Blanks should return assay values below the detection limit. If a blank returns a significant grade, it indicates contamination. Blanks are particularly important after high-grade samples. The insertion rate for blanks is typically 2-5% of samples.
Duplicate samples are repeat analyses used to assess analytical precision and sampling reproducibility. Three types are commonly used: field duplicates, coarse crush duplicates, and pulp duplicates. Field duplicates test the entire sampling process including geological variability, while pulp duplicates test only laboratory precision. The insertion rate is typically 5-10% of samples.
QAQC samples must be inserted blind, meaning the laboratory does not know which samples are controls. This prevents preferential treatment.
Practical Recommendations:
- Design QAQC program before drilling
- Use multiple standards spanning the expected grade range
- Insert QAQC samples blind with regular sample numbers
- Maintain 5-10% insertion rate for standards and duplicates
- Place blanks strategically after high-grade intervals
- Use appropriate blank material barren in elements of interest
- Collect all duplicate types
- Review QAQC results immediately upon receipt
- Set clear acceptance criteria: ±10% for standards, <5× detection for blanks
- Take corrective action promptly on failures
- Document QAQC procedures and corrective actions
6. Statistical Tools for QAQC Monitoring
Statistical tools provide objective methods for evaluating QAQC data and identifying analytical problems. These tools transform raw QAQC results into visual and quantitative metrics that reveal patterns, trends, and anomalies. The primary statistical tools are run charts, control charts, scatterplots, relative difference plots, and precision plots.
Run charts plot measured values over time, showing the sequence of standard or blank results. Run charts are useful for identifying trends, shifts, cycles, or other non-random behaviors.
Control charts are run charts with predefined control limits that define acceptable performance. Control limits are typically set at ±10% of the expected standard value. Points outside the control limits indicate the process is out of control and requires corrective action.
Scatterplots compare duplicate sample pairs by plotting original sample grades versus duplicate sample grades. The one-to-one line represents perfect agreement. Points should scatter around this line with minimal bias and acceptable precision.
Relative difference plots quantify the precision of duplicate pairs by plotting the relative difference [(duplicate – original) / original × 100%] against the original sample grade. Ideally, relative differences should be within ±10% for most samples.
Precision plots use half the absolute difference between duplicate pairs plotted against the average of the pair. Precision lines at 5%, 10%, and 15% show expected precision levels. Laboratory pulp duplicates should show better precision (typically <5%) than field duplicates (typically 10-20%).
Statistical Process Control (SPC) principles guide the interpretation of QAQC data, distinguishing between normal random variation and abnormal systematic variation.
Practical Recommendations:
- Generate QAQC plots automatically as data is received
- Review QAQC data before accepting batches
- Set appropriate control limits: ±10% for base metals, ±5% for precious metals
- Look for patterns, not just outliers
- Compare duplicate types with separate plots
- Track laboratory performance over time
- Use probability concepts to identify non-random behavior
- Investigate all failures with the laboratory
- Document corrective actions in a QAQC log
- Report QAQC results transparently in technical reports
- Use multiple statistical tools together
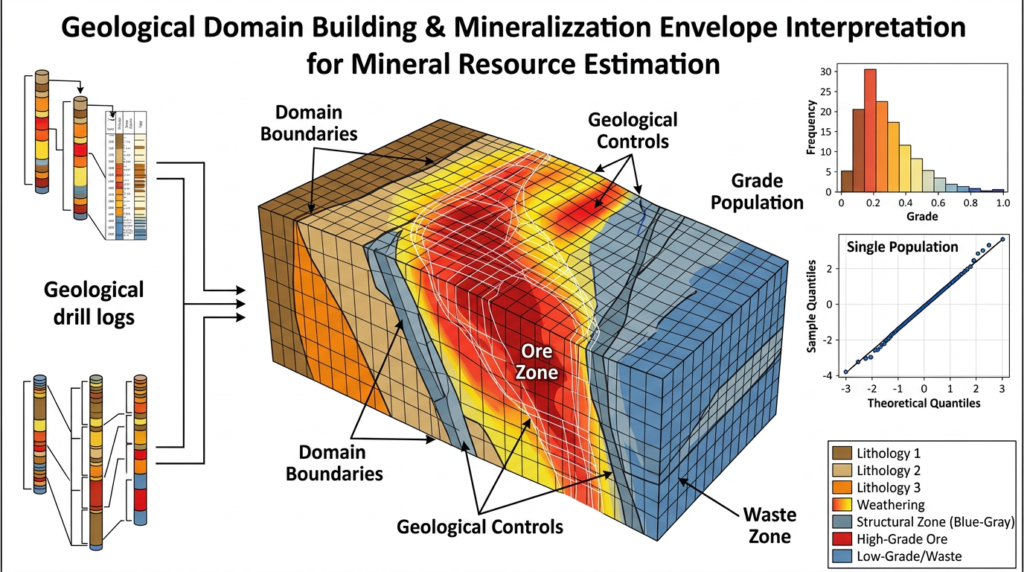
7. Building Geological Domains for Resource Estimation
Geological domains are the foundation of accurate resource estimation. A domain is a spatial volume characterized by consistent geology, a single grade population, and a single orientation of continuity. Proper domain definition ensures that grade estimation uses only relevant samples and respects geological boundaries. Geology is often described as contributing 90% of the accuracy of a resource estimate.
The importance of geological domains stems from the principle that grade blocks should be estimated using samples from the same geological population. If samples from different populations are mixed, the resulting estimates will be over-smoothed and fail to represent either population accurately.
Building geological domains requires understanding the geological controls on mineralization, including genesis, host lithologies, structural controls, alteration patterns, weathering effects, and mineralogy. Different geological interpretations can lead to dramatically different resource estimates and economic outcomes.
The process begins with comprehensive geological logging that captures all factors affecting mineralization. This data is then analyzed statistically to identify populations and their spatial distribution. Two common approaches are the breakdown-and-concatenate method and cluster analysis.
The breakdown-and-concatenate approach involves creating composite codes by combining lithology, alteration, structure, and weathering codes. Histograms are plotted for each composite code to examine grade distributions. Codes with similar distributions are grouped together and visualized in 3D.
Cluster analysis is a statistical technique useful when multiple elements are present or geological controls are unclear. The method groups samples based on similarity across multiple variables. The algorithm iteratively assigns samples to groups until the groupings stabilize.
Three criteria define a valid domain: geological homogeneity, a single grade population, and a single orientation of continuity.
Practical Recommendations:
- Understand the deposit type by studying similar deposits
- Log comprehensively for all features affecting mineralization
- Use standardized codes for geological features
- Analyze grade distributions with histograms
- Visualize in 3D to identify spatial patterns
- Consider multiple geological interpretations
- Separate high-grade zones to avoid grade smearing
- Understand mineralization timing relative to structural events
- Consult diverse expertise to challenge interpretations
- Update models iteratively as new data arrives
- Document geological rationale for domain boundaries
8. Validating Mineralization Domains
Domain validation is a critical step that must occur before detailed wireframing and resource estimation. Validation ensures that proposed domains are geologically sound, statistically valid, and appropriate for grade estimation. The three validation criteria are geological homogeneity, single grade population, and single orientation of continuity.
Geological homogeneity validation involves examining geological evidence to confirm that the domain represents a consistent geological unit. This requires reviewing drill logs, core photographs, cross-sections, and geological reports to build a reasonable explanation for the population.
Single grade population validation uses statistical tools to confirm that the domain contains one population, not a mixture. The primary tools are histograms and probability plots. A histogram should ideally show a single bell-shaped distribution. Probability plots are more sensitive for detecting mixed populations.
A probability plot displays cumulative frequency versus grade on a logarithmic scale. A single lognormal population plots as a straight line. Mixed populations show breaks or curves in the line. If a probability plot shows clear breaks, the domain should be subdivided.
Single orientation validation involves visualizing the domain in 3D to identify significant changes in structural orientation. Mineralization that has been folded or faulted may require sub-domains or unfolding. Variogram analysis in different directions can quantify orientation of continuity.
Validation should be iterative, with domains refined based on validation results. If a domain fails validation, it should be subdivided, merged with adjacent domains, or redefined.
Practical Recommendations:
- Validate before wireframing to avoid wasted effort
- Use probability plots to detect mixed populations
- Review geological evidence to confirm geological support
- Check sample counts, ensuring minimum 50-100 samples per domain
- Test orientation consistency with 3D visualization and variograms
- Subdivide mixed populations if probability plots show breaks
- Merge similar domains if they have similar geology and grades
- Document validation results in technical reports
- Iterate and refine based on validation results
- Involve senior geologists to review interpretations
- Plan infill drilling for areas requiring additional data
9. Conclusion and Best Practices Summary
This technical review has synthesized key concepts and practical recommendations for ensuring data quality in mineral exploration drilling programs. The fundamental principle is that project quality is a function of data quality, and poor data quality cannot be corrected retroactively. Investment in proper drilling methods, geological logging, sampling protocols, QAQC procedures, and geological modeling pays dividends throughout the project lifecycle.
Key themes include: prevention is better than correction, systematic approaches are essential, statistical tools provide objectivity, geological understanding is paramount, validation prevents wasted effort, and continuous improvement is necessary. By following these best practices, exploration programs can ensure high-quality data that supports accurate resource estimates, reduces technical risk, and maximizes project value.