Executive Summary
This report provides a comparative analysis of Cut-Off Grade (COG) strategies and regulatory frameworks across five major mining jurisdictions: Australia, Canada, Indonesia, South Africa, and Chile. A fundamental distinction is observed between economic (operational) COG, used for mine planning and net present value (NPV) maximization, and resource-estimation (reporting) COG, used for regulatory compliance and mineral resource classification.
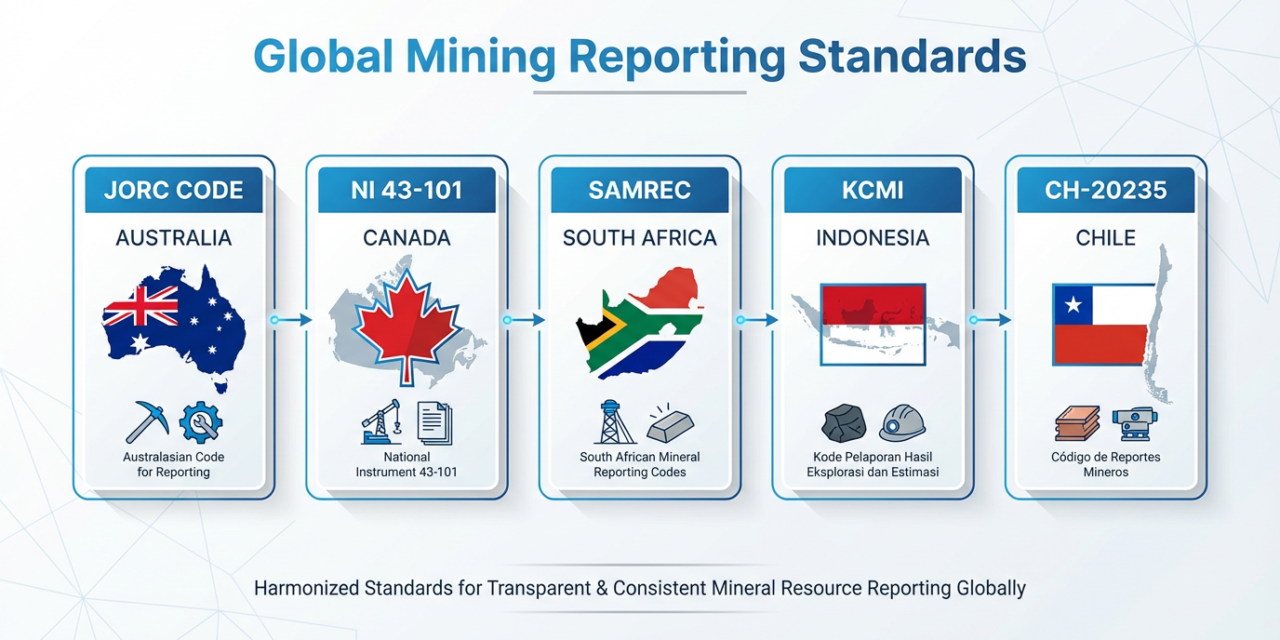
Key findings include the maturity of reporting standards such as the JORC Code (Australia), NI 43-101 (Canada), SAMREC/SAMVAL (South Africa), KCMI (Indonesia), and Law 20.235 (Chile). South African practice is characterized by the explicit integration of mineral royalties and taxes into COG optimization models, which can materially extend mine life. Australian industry demonstrates a high sensitivity to commodity price fluctuations, adjusting COGs dynamically to manage supply. Indonesia’s nickel sector utilizes specific geological COG benchmarks for saprolite and limonite deposits. In Chile, advanced methodologies like the “Hill of Value” are applied to optimize COG in large-scale block caving operations.
1. Introduction
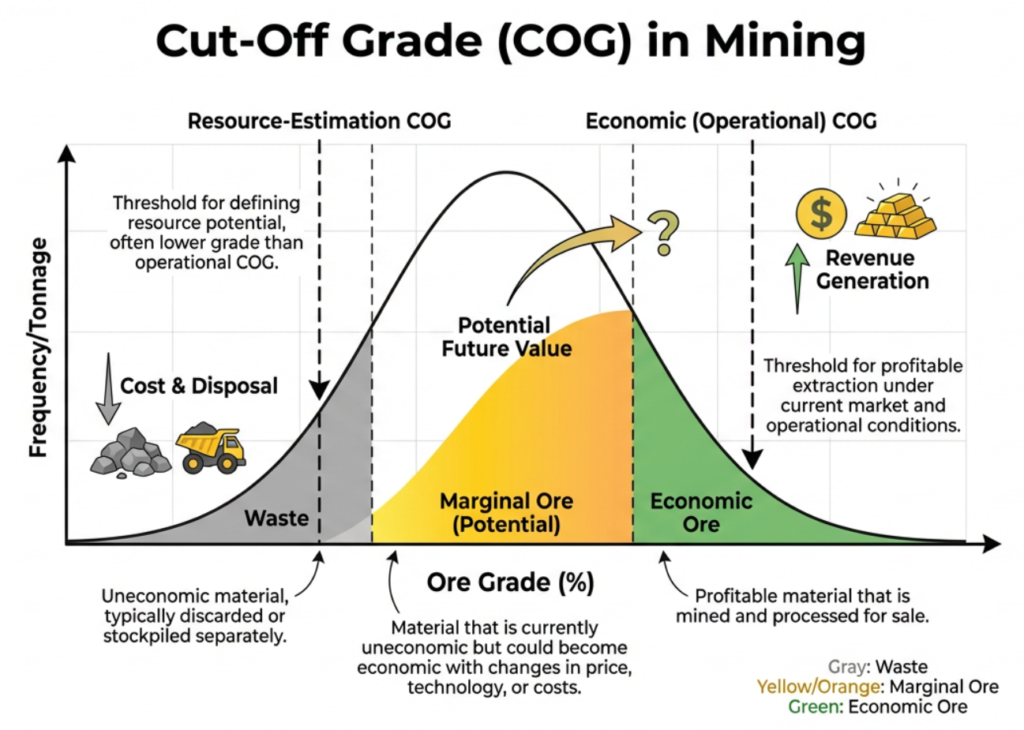
The cut-off grade (COG) is a critical parameter in the mining industry, serving as the threshold that distinguishes between ore (material to be processed) and waste (material to be discarded or stockpiled). Determining the COG is not merely a technical exercise but a strategic decision that influences a mine’s production rate, life-of-mine (LOM) value, and regulatory standing. As global mining operations face declining ore grades and increasing economic volatility, the adoption of sophisticated COG strategies has become essential for maintaining profitability and ensuring sustainable resource management. This report compares the COG strategies and reporting standards of Australia, Canada, Indonesia, South Africa, and Chile, highlighting how local regulations and economic factors shape industry practices.
2. Economic vs. Resource-Estimation COG
A clear distinction exists in the literature and industry practice between two primary types of COG:
- Economic Cut-Off Grade (Operational/Break-Even): This is the minimum grade at which a unit of material covers its full economic cost (mining, processing, G&A, and selling costs). The primary goal is to maximize profit or the NPV of the project [1], [10]. This grade is dynamic, frequently recalculated in response to changes in metal prices, operational costs, and metallurgical recoveries [10].
- Resource-Estimation Cut-Off Grade (Geological/Reporting): This grade is used to define the mineral resource for regulatory reporting. It is based on the principle of “reasonable prospects for eventual economic extraction” [10]. Unlike the economic COG, the reporting COG is often treated as a static benchmark for a reporting cycle and uses long-term “anchor” prices and costs [10].
In practice, the geological COG used for resource modeling is often lower than the operational COG used during active mining, allowing for the inclusion of marginal material that may become profitable under future economic conditions [10].
3. Regulatory Reporting Standards
South African Gold Tax & Mineral Resources Royalty Regime – Impact on COG. These standards ensure transparency and protect investors by requiring that COG assumptions be clearly stated.

The JORC (Australia), NI 43-101 (Canada), and SAMREC (South Africa) codes are part of the CRIRSCO (Committee for Mineral Reserves International Reporting Standards) family, ensuring a high degree of international comparability. Indonesia’s KCMI code also aligns with these international principles. Chile’s Law 20.235 establishes the regulatory framework for the public reporting of mining assets, supported by a professional body of “Qualified Competent Persons.”
4. Jurisdiction-Specific Practices
4.1 South Africa
South African mining practice is distinguished by its sophisticated integration of financial variables into COG optimization.
- Tax and Royalty Integration: Research on South African gold mines demonstrates that incorporating variable mineral royalties and income tax into COG optimizers can result in lower break-even grades and a significant extension of mine life [1]. The South African gold tax and mineral resource royalty regime is unique in its complexity, and the integration of these factors into the block-by-block financial model allows for a more accurate determination of the economic margin [1]. One study showed that such optimization could increase stope tonnage and total revenue by approximately 6% compared to a simple break-even approach [1].
- Uncertainty Management: South African practitioners often adjust COGs downward (by as much as 22% in some cases) to account for grade-estimation uncertainty, particularly in the complex Witwatersrand gold deposits [3], [6]. This adjustment is not arbitrary but is based on empirical models that link the probability of grade distribution to the economic risk of mining below-grade material [3].
- Valuation Methods: Industry practice heavily relies on Discounted Cash Flow (DCF) and NPV models as recommended by the SAMVAL code for asset valuation [2]. The selection of the discount rate is a critical factor, as it determines the present value of future cash flows and thus the optimal grade profile over time [2].

4.2 Australia
Australia’s approach focuses on the strategic response of mining operations to global market conditions and the application of cutoff-grade theory at an industry scale.
- Price-Driven Grade Management: Australian gold mines have been observed to adjust their COGs and throughput rates dynamically in response to price changes. Profit-maximizing models are used to study and predict supply responses to market volatility [8]. When gold prices rise, operations may lower the COG to process lower-grade material, thereby extending the mine life and maximizing the total ounces recovered [8]. Conversely, in low-price environments, the COG is raised to focus on “high-grading” the deposit to maintain cash flow [8].
- Regulatory Frameworks: Assessment and valuation guidelines used in Australia include the Valmin framework, which supports the reporting requirements of the JORC Code [5]. There is also a significant focus on broader regulatory issues, such as mine rehabilitation and closure rules on indigenous lands, which have long-term implications for the economic sustainability of mining projects [5].
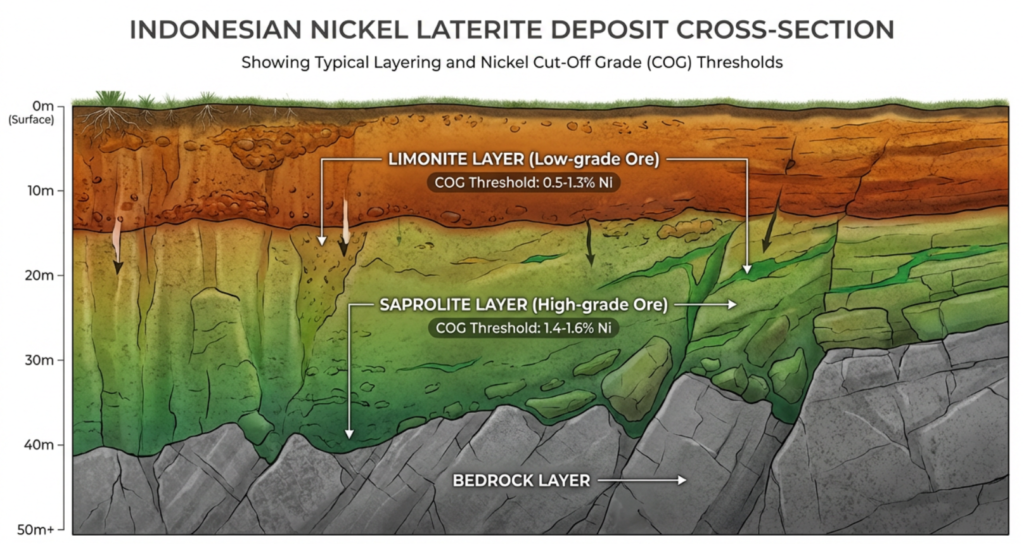
4.3 Indonesia
The Indonesian mining sector, particularly for nickel laterite, follows specific technical-economic benchmarks that are influential in the region.
- Nickel-Specific COGs: Common practice for nickel reporting involves using a resource COG of 1.4–1.6% Ni for saprolite (high-grade ore) and 0.5–1.3% Ni for limonite (low-grade ore) [10]. These benchmarks are chosen to reflect what can reasonably be processed given assumed technology and current markets, rather than what is optimal in any single year [10].
- KCMI Compliance: The KCMI (Komite Cadangan Mineral Indonesia) code provides the framework for these declarations, ensuring they meet “reasonable prospects for eventual economic extraction” [10]. The code is closely aligned with international standards like JORC and NI 43-101.
- Formulaic Approaches: Break-even COG in Indonesia is often calculated using a formula that equates revenue per tonne (incorporating metal price, metallurgical recovery, and payable percentage) to the sum of mining, processing, G&A, and selling costs [10].
4.4 Chile
Chilean practice is shaped by the country’s status as a world leader in copper and lithium production and its use of large-scale underground mining methods.
- NPV Optimization in Block Caving: For large-scale block caving operations, the “Hill of Value” methodology is used to estimate the optimal COG profile. This method allows engineers to explore scenarios where higher-than-marginal COGs are applied in the initial phases to maximize NPV and reduce project uncertainty [9]. The methodology considers the trade-off between the production rate and the COG to find the “peak” of the NPV hill [9].
- Resource Magnitude: With Chile possessing 33.6% of global lithium reserves and producing 5.5 million tonnes of copper annually, the application of marginal COG is standard for initial resource estimation, but strategic optimization is applied to the footprint and ore body size to maximize enterprise value [9].
- Reporting Standards: Reporting of mining assets is governed by Law 20.235, which requires the certification of reserves by competent persons registered with the Mining Commission.
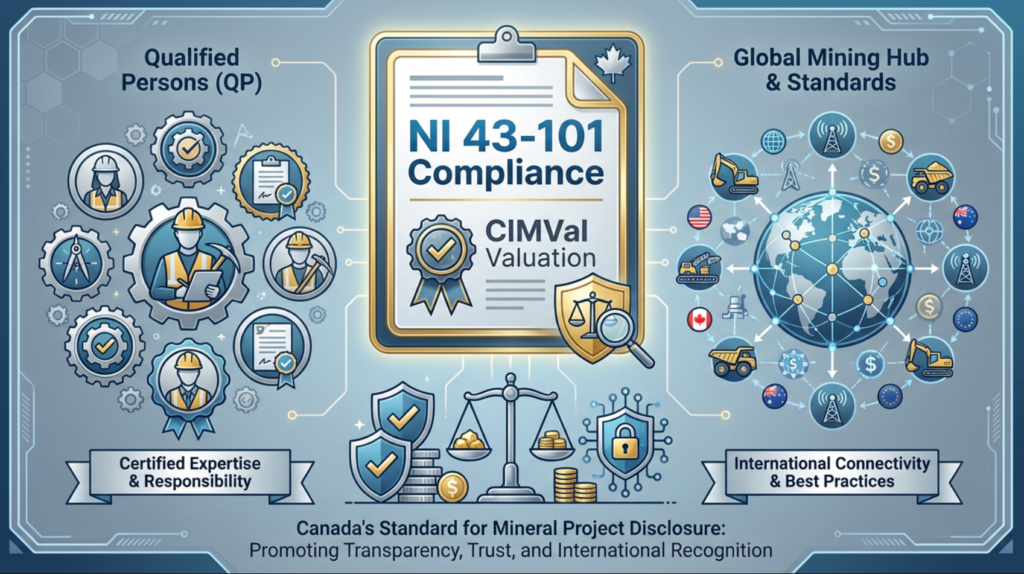
4.5 Canada
Canada is recognized for its mature and influential regulatory environment and its role as a global hub for mining finance.
- Guideline-Driven Reporting: While the specific operational COG rules are not always detailed in national regulations, industry practice is strictly guided by the CIMVal (Canadian Institute of Mining, Metallurgy and Petroleum Valuation) and NI 43-101 Standards of Disclosure for Mineral Projects. These frameworks are frequently cited as exemplars for mining sector reforms globally [2], [7].
- Influence on Global Standards: Canadian assessment guidelines are among the most referenced in comparative studies of international mining jurisdictions. The NI 43-101 standard is particularly noted for its rigorous requirements regarding the disclosure of the methods and assumptions (including COG) used to estimate resources [5].
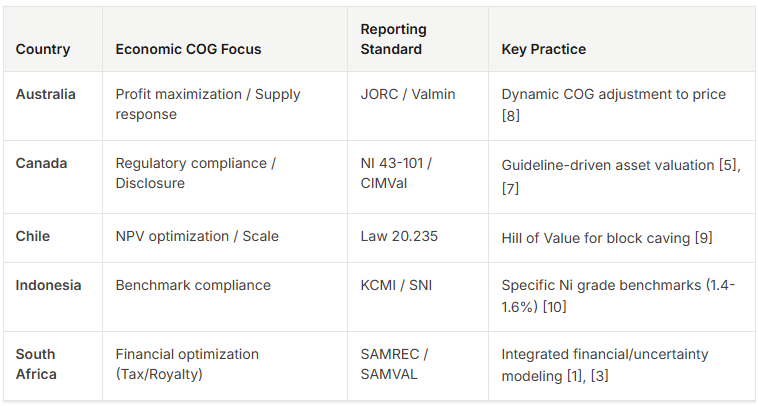
5. Comparative Analysis of Industry Practices
The following table summarizes the key COG practices and reporting requirements across the five jurisdictions.
6. Limitations of the Evidence
The current corpus of literature has several limitations:
- Specific Regulatory Wording: For some countries, such as Canada, the provided sources describe the existence of frameworks (e.g., NI 43-101) but do not provide the exact regulatory text concerning COG minimums.
- Commodity Bias: Much of the detailed COG research is focused on gold (South Africa, Australia) and nickel (Indonesia), with less granular data on other minerals like lithium.
- Geographic Gaps: While general reporting codes for Chile are known (Law 20.235), the provided scholarly evidence for Chile is less extensive than that for South Africa or Australia.
7. Research Gaps and Future Directions
- Lithium COG Standards: As Chile and Australia compete in the lithium market, there is a need for more research into standardized COG practices for brine-based and hard-rock lithium deposits.
- Automation and AI: Future COG strategies are expected to incorporate real-time sensor data and AI-driven optimization, but the current literature provides limited evidence of these technologies’ implementation across these five countries.
- Environmental COG: There is a growing need to incorporate carbon pricing and environmental rehabilitation costs into the “economic” COG formula.
8. Conclusion
The management of Cut-Off Grades (COG) is a sophisticated blend of engineering, economics, and regulatory compliance. Australia, Canada, Indonesia, South Africa, and Chile all maintain robust reporting standards (JORC, NI 43-101, KCMI, SAMREC, Law 20.235) that distinguish between geological potential and operational reality. While the core principles of COG are universal, jurisdictional differences in tax regimes, market responsiveness, and geological deposit types have led to distinct industry practices. South Africa’s focus on financial modeling, Australia’s market agility, and Chile’s large-scale optimization reflect the diverse ways in which COG theory is applied to maximize the value of global mineral resources.
9. References
[1] Birch et al., “Optimizing the cut-off grade for tabular gold deposits, considering the South African gold tax and mineral resource royalty regime,” Journal of The South African Institute of Mining and Metallurgy, vol. 124, 2024. DOI: 10.17159/2411-9717/3195/2024
[2] Birch, “Impact of discount rates on cut-off grades for narrow tabular gold deposits,” Journal of The South African Institute of Mining and Metallurgy, vol. 116, no. 2, 2016. DOI: 10.17159/2411-9717/2016/V116N2A2
[3] Birch, “Optimizing cut-off grade considering grade estimation uncertainty – A case study of Witwatersrand gold-producing areas,” Journal of The South African Institute of Mining and Metallurgy, vol. 122, 2022. DOI: 10.17159/2411-9717/1403/2022
[4] 陈义政 et al., “Comparison of assessment guidelines of mining properties,” Non-Ferrous Mining and Metallurgy, 2009. DOI: 10.3969/j.issn.1673-2464.2009.03.028
[5] “Regulación de la rehabilitación y el cierre de minas en tierras de propiedad indígena: Perspectivas de los Estados con recursos regulados de Australia y Canadá,” Revue Internationale de Politique de Développement, 2023. DOI: 10.4000/poldev.5319
[6] Ramphore et al., “The Effect of Cut-off Grade and Mine Value Optimization on Mining Projects in South African Mines: A Mini-review,” 2022. DOI: 10.17758/iicbe3.c0322209
[7] Campbell et al., “La réforme des cadres réglementaires dans le secteur minier : Les expériences canadienne et africaine mises en perspective,” 2012. DOI: 10.7202/1009370AR
[8] Evans et al., “Australian gold supply response: An application of cutoff grade theory,” 2000.
[9] Vera et al., “A new methodology based on hill of value for ore reserve selection in long-term planning for block caving,” Mining, Metallurgy & Exploration, vol. 37, 2020. DOI: 10.1007/S42461-019-00152-1
[10] Join Damanik, “Economic Cut-Off Grade for Nickel vs. Resource-Estimation Cut-Off Grade,” LinkedIn, 2025. [Online]. Available: https://www.linkedin.com/pulse/economic-cutoff-grade-nickel-vs-resourceestimation-join-damanik-fyzic/


