Variogram validation is central to building reliable geostatistical models and, ultimately, trustworthy resource block models in mining and petroleum applications. A sound variogram links sparse sample data to 3D estimates and uncertainty.
What Is Variogram Validation?
A variogram model describes how similarity between sample values decreases with distance. Validation checks whether this model:
- Adequately represents the experimental (sample) variogram
- Produces accurate and unbiased spatial predictions
- Is geologically and physically reasonable
Guides such as Oliver & Webster and Deutsch & Gringarten emphasize that small changes in the variogram can significantly alter kriging errors and model behavior, so careful validation is essential (Oliver and Webster, 2014; Gringarten and Deutsch, 2001; Gringarten and Deutsch, 1999; Myers, 1998).
Step‑by‑Step Variogram Validation
1. Compute and Inspect the Experimental Variogram
- Calculate semi‑variance from sample pairs binned into distance “lags” and, if needed, directions (Díaz et al., 2022; Oliver and Webster, 2014; Vasquez and Swift, 2022).
- Choose lag size and maximum distance so that each bin has enough pairs (≈30 or more) and the structure near the origin is visible; too small a lag yields noisy curves, too large hides continuity details (Díaz et al., 2022; Oliver and Webster, 2014).
- Use variogram clouds and directional variograms to reveal anisotropy and hidden structures (Díaz et al., 2022; Gringarten and Deutsch, 2001).
2. Fit Candidate Theoretical Models
- Fit models (spherical, exponential, Gaussian, nested structures, hole‑effect, etc.) respecting valid covariance theory (Oliver and Webster, 2014; Gringarten and Deutsch, 2001; Myers, 1998).
- Estimate nugget, sill, and range parameters; many studies use weighted least‑squares or optimization against RMSE and R² between experimental and model variograms (Boroh et al., 2025; Oliver and Webster, 2014; Menezes, García-Soidán and Febrero-Bande, 2005; Marwanza et al., 2025).
- In 3D mining applications, tools such as RecMin Variograms and variogram maps help select directions, lags, and bandwidths, making experimental variograms more representative of ore grade data (Díaz et al., 2022).
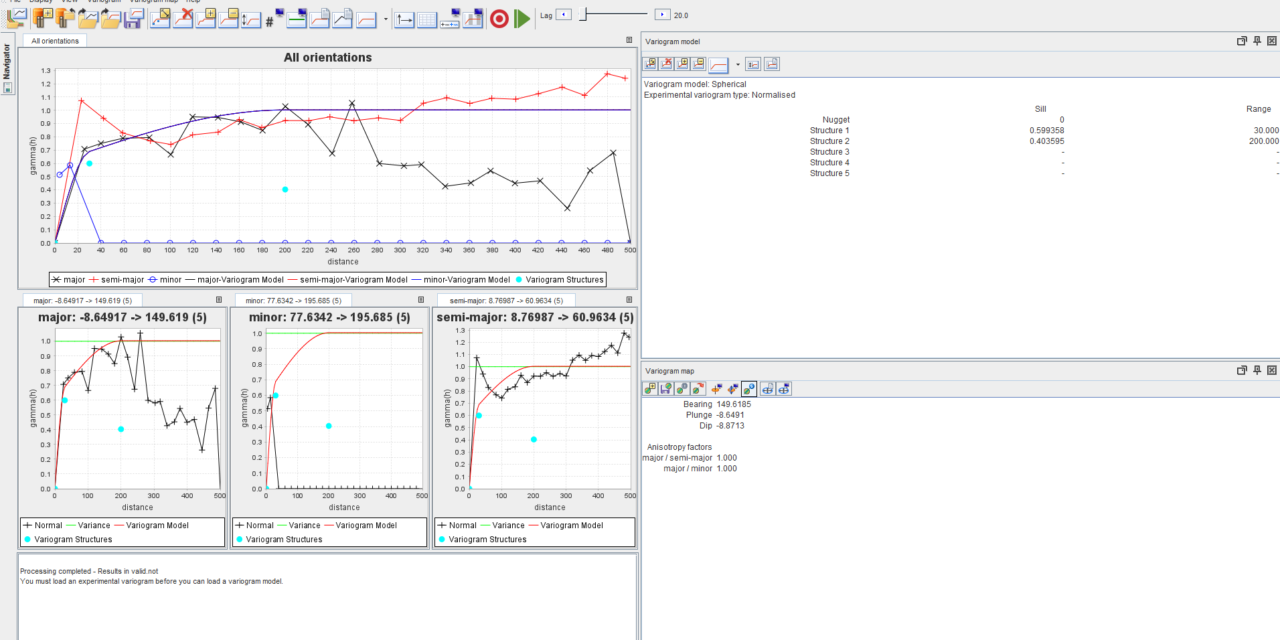
3. Graphical and Numerical Diagnostics
- Visually compare model curves with experimental points, focusing on:
- Behavior near the origin (controls short‑range smoothing and kriging variance)
- Reproduction of sill and range
- Directional anisotropy (Oliver and Webster, 2014; Gringarten and Deutsch, 2001; Myers, 1998)- Quantify misfit via weighted sums of squared residuals or similar statistics (Oliver and Webster, 2014; Menezes, García-Soidán and Febrero-Bande, 2005; Marwanza et al., 2025).
Some modern approaches optimize variogram parameters by minimizing cross‑validation errors, sometimes using genetic algorithms or machine learning regression to refine range, sill, and nugget (Boroh et al., 2025; Walia, Maucec and Khattab, 2023; Marwanza et al., 2025).
4. Cross‑Validation
Cross‑validation links the variogram directly to prediction performance:
- Perform leave‑one‑out or K‑fold cross‑validation: each sample is temporarily removed, predicted via kriging with the candidate variogram, then compared to its true value (Vasquez and Swift, 2022; Barca et al., 2016; Myers, 1998; Marwanza et al., 2025).
- Compute indices such as mean error, mean absolute error, RMSE, kriging efficiency, and slope of regression (Barca et al., 2016; Taghvaeenezhad et al., 2020; Myers, 1998).
- Plot predicted vs. observed values and standardized residuals; a good model shows near‑zero bias and unit‑variance standardized errors (Vasquez and Swift, 2022; Barca et al., 2016; Myers, 1998).
Automated decision‑support systems now combine these indices and residual variograms into reports to help practitioners rate variogram models and decide if refinement is needed (Barca et al., 2016).
5. Residual Variogram and Model Refinement
- Compute a variogram of kriging residuals. Significant remaining structure indicates that the variogram is under‑ or over‑smoothed, or missing anisotropy or nested scales (Barca et al., 2016; Gringarten and Deutsch, 1999).
- Adjust model type (e.g., introduce nesting or hole‑effect), ranges, or nugget, and repeat cross‑validation until residual spatial dependence is minimized and diagnostics stabilize (Oliver and Webster, 2014; Gringarten and Deutsch, 2001; Barca et al., 2016; Gringarten and Deutsch, 1999).
6. Advanced Consistency Checks
- For multigaussian or other two‑point models, additional diagnostics such as variograms of order ω can check internal consistency of bivariate distributions, not just the standard second‑order variogram (Emery, 2005).
- In simulation, realizations should reproduce the input variogram; specialized procedures test whether simulated models honor the target variogram within acceptable tolerance (Cabrera and Leuangthong, 2007).
Key Validation Criteria
| Criterion | What to Look For |
|---|---|
| Fit to experimental variogram | Good visual match; low weighted misfit |
| Cross‑validation statistics | Low RMSE/MAE; mean error ≈ 0; high kriging efficiency |
| Residual spatial structure | Weak residual variogram; no strong anisotropy left |
| Geological/physical plausibility | Ranges, anisotropy, nesting consistent with geology |
Figure 1: Core criteria used to validate variogram models.
Benefits of Rigorous Variogram Validation
Validated variograms bring several concrete advantages:
- Higher prediction accuracy: Optimized variograms significantly reduce prediction errors and improve R² in interpolation and simulation, as shown in gravity mapping and nickel resource estimation (Boroh et al., 2025; Vasquez and Swift, 2022; Marwanza et al., 2025).
- Realistic uncertainty quantification: Proper ranges and nugget ratios yield kriging variances and simulation variability that better reflect true spatial uncertainty, improving risk assessment and history matching in reservoirs (Walia, Maucec and Khattab, 2023; Gringarten and Deutsch, 1999; Taghvaeenezhad et al., 2020).
- Geologically consistent continuity: Methodologies that integrate geological interpretation with variogram modeling produce spatial models whose continuity trends align with depositional structures and faults, improving reservoir and orebody realism (Vasquez and Swift, 2022; Gringarten and Deutsch, 2001; Gringarten and Deutsch, 1999).
- Better economic decisions: Different geostatistical models (and associated variograms) can change estimated reserves, NPV, IRR, and mine design by >10–18%, emphasizing the financial impact of getting the variability model right (Kopacz et al., 2020; Taghvaeenezhad et al., 2020).

How the Variogram Model Drives the Resource Block Model
Once validated, the variogram becomes the core control on how grades or properties are distributed in a 3D block model.
From Variogram to Block Grades
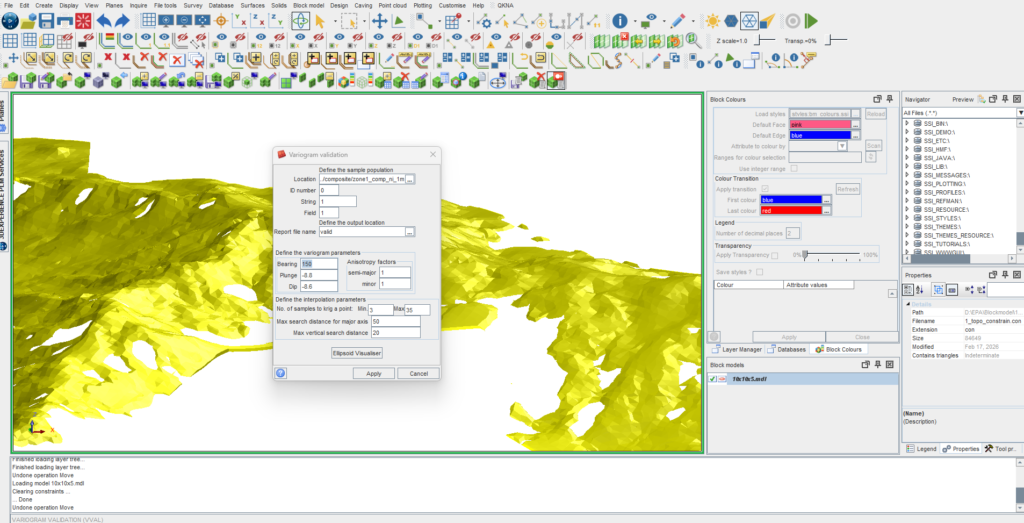
- Domain definition and block grid
Geological interpretation defines domains or lithological units; these are discretized into a regular block model (Díaz et al., 2022; Vasquez and Swift, 2022; Basargin, 2025). - Domain‑specific variograms
Within each domain, directional variograms are computed and modeled to capture continuity and anisotropy of grade or facies (Díaz et al., 2022; Vasquez and Swift, 2022; Basargin, 2025; Madani and Maleki, 2023). - Kriging and simulation of blocks
- Ordinary kriging uses the variogram to compute weights and estimation variance for each block; the fitted nugget, sill, and range control smoothing and local variability (Oliver and Webster, 2014; Myers, 1998; Marwanza et al., 2025).
- Sequential simulation uses the variogram to generate multiple realizations that reproduce the modeled spatial continuity, forming ensembles of possible block models (Boroh et al., 2025; Walia, Maucec and Khattab, 2023; Gringarten and Deutsch, 1999; Madani and Maleki, 2023).
Controls on Block Model Behavior
- Search ellipses and anisotropy: Variogram ranges and principal directions define search radii and ellipsoid orientations used to select samples around each block, thus governing which data influence each estimate (Díaz et al., 2022; Vasquez and Swift, 2022; Basargin, 2025).
- Block size and change of support: Variogram models are regularized to block support; the relationship between point and block variances guides appropriate block sizes so that modeled variability matches practical mining scales (Myers, 1998).
- Grade continuity and connectivity: The validated variogram dictates how continuous high‑grade zones are in the block model, affecting selective mining, pit optimization, and predicted flow in reservoirs (Gringarten and Deutsch, 2001; Walia, Maucec and Khattab, 2023; Gringarten and Deutsch, 1999; Madani and Maleki, 2023).
- Resource classification: Kriging variance and related indices (kriging efficiency, slope of regression, block estimation error) derived from the variogram feed directly into JORC‑style resource classification into Measured, Indicated, and Inferred categories (Taghvaeenezhad et al., 2020; Marwanza et al., 2025).
In studies of uranium and nickel deposits, optimal variogram parameters led to block models with well‑quantified uncertainty, enabling objective classification and more reliable tonnage and grade estimates (Taghvaeenezhad et al., 2020; Marwanza et al., 2025).
Why Variogram Validation Matters for Block Models
Poorly validated variograms propagate into block models as:
- Over‑ or under‑smoothed grade distributions
- Misleading continuity of ore above cut‑off
- Misestimated classification confidence and economic indicators (Gringarten and Deutsch, 2001; Kopacz et al., 2020; Taghvaeenezhad et al., 2020; Myers, 1998)Validated variograms, by contrast, anchor the block model in both the data and the geology, yielding spatial distributions, uncertainties, and economic forecasts that are consistent and defensible.
References
Boroh, A., Fokem, A., Mfenjou, M., Hamat, F., & Besseme, F., 2025. Variogram modelling optimisation using Genetic Algorithm and Machine Learning Linear Regression: application for Sequential Gaussian Simulations mapping. Artificial Intelligence in Geosciences. https://doi.org/10.1016/j.aiig.2025.100124
Díaz, A., Fernández, C., Ares, G., Prieto, D., & Álvarez, I., 2022. RecMin Variograms: Visualisation and Three-Dimensional Calculation of Variograms in Block Modelling Applications in Geology and Mining. International Journal of Environmental Research and Public Health, 19. https://doi.org/10.3390/ijerph191912454
Oliver, M., & Webster, R., 2014. A tutorial guide to geostatistics: Computing and modelling variograms and kriging. Catena, 113, pp. 56-69. https://doi.org/10.1016/j.catena.2013.09.006
Vasquez, D., & Swift, J., 2022. Using geostatistics to generate a geological model of a sandstone petroleum reservoir in southern California. Geographica Pannonica. https://doi.org/10.5937/gp26-33244
Gringarten, E., & Deutsch, C., 2001. Teacher’s Aide Variogram Interpretation and Modeling. Mathematical Geology, 33, pp. 507-534. https://doi.org/10.1023/a:1011093014141
Barca, E., Porcu, E., Bruno, D., & Passarella, G., 2016. An automated decision support system for aided assessment of variogram models. Environ. Model. Softw., 87, pp. 72-83. https://doi.org/10.1016/j.envsoft.2016.11.004
Walia, S., Maucec, M., & Khattab, S., 2023. Quantification of Variogram Range Uncertainties and Their Impact on Stochastic Property Distribution and Dynamic Model Variability. Fifth EAGE Conference on Petroleum Geostatistics. https://doi.org/10.3997/2214-4609.202335045
Kopacz, M., Kulpa, J., Galica, D., & Olczak, P., 2020. The influence of variability models for selected geological parameters on the resource base and economic efficiency measures – Example of coking coal deposit. Resources Policy, 68, pp. 101711. https://doi.org/10.1016/j.resourpol.2020.101711
Gringarten, E., & Deutsch, C., 1999. Methodology for Variogram Interpretation and Modeling for Improved Reservoir Characterization. **, pp. 355-367. https://doi.org/10.2118/56654-ms
Basargin, А., 2025. Application of geostatistical analysis methods for assessment of the resource potential of a gold ore deposit. Mine Surveying and Subsurface Use. https://doi.org/10.56195/20793332-2025-25-3-66-72
Cabrera, J., & Leuangthong, O., 2007. A PRACTICAL APPROACH TO VALIDATE THE VARIOGRAM REPRODUCTION FROM GEOSTATISTICAL SIMULATION. **.
Taghvaeenezhad, M., Shayestehfar, M., Moarefvand, P., & Rezaei, A., 2020. Quantifying the criteria for classification of mineral resources and reserves through the estimation of block model uncertainty using geostatistical methods: a case study of Khoshoumi Uranium deposit in Yazd, Iran. Geosystem Engineering, 23, pp. 216 – 225. https://doi.org/10.1080/12269328.2020.1748524
Emery, X., 2005. Variograms of Order ω: A Tool to Validate a Bivariate Distribution Model. Mathematical Geology, 37, pp. 163-181. https://doi.org/10.1007/s11004-005-1307-4
Myers, D., 1998. Basic Linear Geostatistics. Technometrics, 42, pp. 437 – 437. https://doi.org/10.1080/00401706.2000.10485732
Madani, N., & Maleki, M., 2023. Joint simulation of cross-correlated ore grades and geological domains: an application to mineral resource modeling. Frontiers of Earth Science, 17, pp. 417-436. https://doi.org/10.1007/s11707-022-1014-1
Menezes, R., García-Soidán, P., & Febrero-Bande, M., 2005. A comparison of approaches for valid variogram achievement. Computational Statistics, 20, pp. 623-642. https://doi.org/10.1007/bf02741319
Marwanza, I., Putra, D., Azizi, M., Dahani, W., Gumay, R., & Sahetapy, S., 2025. Geostatistical Modeling using Ordinary Kriging for Estimating Nickel Resources in Sulawesi Indonesia. Journal of Multidisciplinary Applied Natural Science. https://doi.org/10.47352/jmans.2774-3047.252


