
Geovia Surpac and Variogram Experiments in Geostatistics
Geostatistics relies on variograms to quantify how a geological variable (such as grade) changes with distance in space. Modern mine‑planning workflows increasingly depend on 3D software like Geovia Surpac to organize drilling data, build geological models, and perform variogram analysis as a basis for kriging and resource estimation (Song and An, 2018; Ling-Yan, 2008; Gringarten and Deutsch, 2001).
Role of Variograms in Geostatistics
A variogram describes how similarity between sample values decreases as the distance between them increases. It is a central tool for:
- Characterizing spatial structure and randomness of ore grades or other regionalized variables (Song and An, 2018; Ling-Yan, 2008; Oliver and Webster, 2014; Mälicke, 2021)- Identifying anisotropy, where continuity differs along strike, dip, and vertical directions (Song and An, 2018; Karami et al., 2018; Ly, Charles and Dégre, 2011)- Providing the required input for kriging and other interpolation methods (Song and An, 2018; Oliver and Webster, 2014; Karami et al., 2018; Mälicke, 2021; Gringarten and Deutsch, 2001)Accurate experimental variograms and well‑fitted theoretical models (e.g., spherical, exponential, Gaussian) are crucial, as small changes in model parameters can significantly alter kriging results (Oliver and Webster, 2014; Karami et al., 2018; Mälicke, 2021; Gringarten and Deutsch, 2001).
Surpac as a Platform for Variogram Experiments
Surpac’s primary contribution is to integrate database management, 3D modeling, and geostatistics in a single environment, allowing geologists and engineers to perform variogram experiments closely tied to geology (Song and An, 2018; Ling-Yan, 2008). In practical mineral deposit studies:
- Surpac is used to build geological databases, digital terrain models (DTM), ore‑body wireframes, and grade models (Song and An, 2018; Ling-Yan, 2008)- Drill samples are composited and statistically analyzed within Surpac before variography, including outlier handling to reduce bias (Song and An, 2018)- Experimental variograms are computed along strike, dip, and vertical directions, capturing anisotropy of the ore body (Song and An, 2018; Ling-Yan, 2008; Ly, Charles and Dégre, 2011; Gringarten and Deutsch, 2001)- The resulting models feed directly into ordinary kriging for grade and tonnage estimation (Song and An, 2018; Ling-Yan, 2008; Karami et al., 2018; Ly, Charles and Dégre, 2011)In the Sujishan graphite deposit, for example, Surpac supported 3D geological modeling, directional variogram construction, and fitting of spherical models, leading to reliable kriging‑based resource estimates that compared favorably with traditional methods (Song and An, 2018). A similar approach was adopted in the Dulong tin–polymetallic deposit, where Surpac was used to analyze variograms of tin and zinc grades and interpret spatial structures geologically (Ling-Yan, 2008).
Workflow of Variogram Experiments in Surpac
A typical Surpac‑based variogram workflow, consistent with broader geostatistical practice, consists of:
- Data preparation and compositing
- Exploratory data analysis
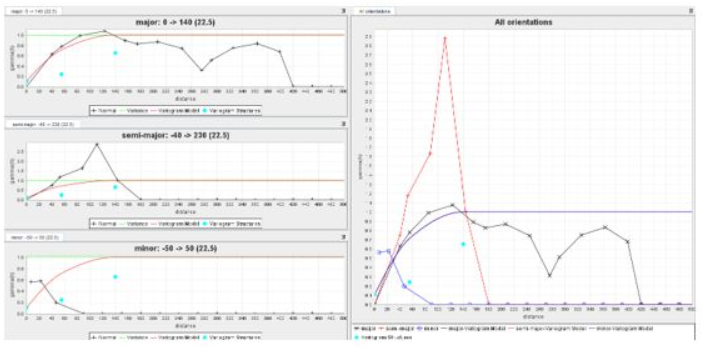
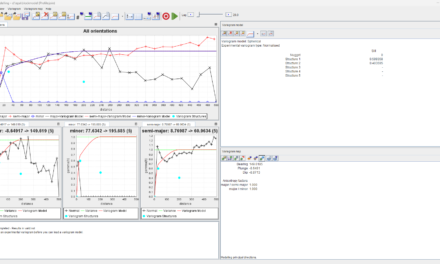
- Experimental variogram calculation
- Model fitting and parameter selection
- Integration with kriging
Surpac adds value by tightly coupling these steps with 3D visualization of ore bodies, making the structural interpretation of variograms more intuitive and geologically consistent (Song and An, 2018; Ling-Yan, 2008; Gringarten and Deutsch, 2001).
Advantages and Limitations
Studies using Surpac‑based workflows report that geostatistical estimates guided by robust variograms produce more reliable grade and resource models than traditional, purely deterministic approaches (Song and An, 2018; Ling-Yan, 2008; Karami et al., 2018). This improves dynamic resource management and supports better mine planning decisions (Song and An, 2018; Karami et al., 2018).
However, the general geostatistical literature emphasizes that software automation can encourage users to “press buttons” without critically evaluating variogram quality, potentially leading to misleading results (Oliver and Webster, 2014; Mälicke, 2021; Gringarten and Deutsch, 2001; Mälicke, Guadagnini and Zehe, 2023). Independent tools and tutorials stress the need for informed model selection, anisotropy analysis, and uncertainty assessment, regardless of platform (Oliver and Webster, 2014; Mälicke, 2021; Pannatier, 1996; Mälicke, Guadagnini and Zehe, 2023).
In this context, Surpac is best viewed as a powerful but not self‑sufficient environment: it efficiently implements variogram experiments and integrates them with 3D models, but sound results still depend on geostatistical understanding, careful diagnostic checks, and geological judgment (Song and An, 2018; Ling-Yan, 2008; Oliver and Webster, 2014; Mälicke, 2021; Gringarten and Deutsch, 2001; Mälicke, Guadagnini and Zehe, 2023).
Summary Table: Surpac’s Role in Variogram Experiments
Aspect Surpac’s Contribution Geostatistical Context Citations Data & 3D models Manages drill data, DTMs, ore‑body and grade models Provides spatial framework for variography (Song and An, 2018; Ling-Yan, 2008) Experimental variograms Computes directional variograms (strike, dip, vertical) Quantifies spatial dependence and anisotropy (Song and An, 2018; Ling-Yan, 2008; Oliver and Webster, 2014; Ly, Charles and Dégre, 2011; Gringarten and Deutsch, 2001) Model fitting Supports fitting of models (e.g., spherical) and parameter extraction Supplies nugget, sill, range to kriging (Song and An, 2018; Oliver and Webster, 2014; Karami et al., 2018; Ly, Charles and Dégre, 2011; Gringarten and Deutsch, 2001) Kriging integration Uses variogram models in resource estimation Produces unbiased, minimum‑variance estimates (Song and An, 2018; Ling-Yan, 2008; Oliver and Webster, 2014; Karami et al., 2018)
Figure 1: Summary of how Surpac supports variogram-based geostatistics.
References
Song, H., & An, H., 2018. APPLICATION OF GEOSTATISTICS IN THE ESTI MATION OF SUJISHAN GRAPHITE DEPOSITS, MONGOLIA. **, 27, pp. 487-499. https://doi.org/10.14311/cej.2018.04.0039
Ling-Yan, Z., 2008. APPLICATION OF VARIOGRAM IN THE DULONG TIN POLYMETALLIC DEPOSIT. Geology and Prospecting.
Oliver, M., & Webster, R., 2014. A tutorial guide to geostatistics: Computing and modelling variograms and kriging. Catena, 113, pp. 56-69. https://doi.org/10.1016/j.catena.2013.09.006
Karami, S., Madani, H., Katibeh, H., & Marj, A., 2018. Assessment and modeling of the groundwater hydrogeochemical quality parameters via geostatistical approaches. Applied Water Science, 8, pp. 1-13. https://doi.org/10.1007/s13201-018-0641-x
Rossi, R., Mulla, D., Journel, A., & Franz, E., 1992. Geostatistical Tools for Modeling and Interpreting Ecological Spatial Dependence. Ecological Monographs, 62, pp. 277-314. https://doi.org/10.2307/2937096
Mälicke, M., 2021. SciKit-GStat 1.0: A SciPy flavoured geostatistical variogram estimation toolbox written in Python. Geoscientific Model Development. https://doi.org/10.5194/gmd-2021-174
Ly, S., Charles, C., & Dégre, A., 2011. Geostatistical interpolation of daily rainfall at catchment scale: the use of several variogram models in the Ourthe and Ambleve catchments, Belgium. Hydrology and Earth System Sciences, 15, pp. 2259-2274. https://doi.org/10.5194/hess-15-2259-2011
Pannatier, Y., 1996. Variowin: Software for Spatial Data Analysis in 2D. **. https://doi.org/10.2307/2965615
Gringarten, E., & Deutsch, C., 2001. Teacher’s Aide Variogram Interpretation and Modeling. Mathematical Geology, 33, pp. 507-534. https://doi.org/10.1023/a:1011093014141
Mälicke, M., Guadagnini, A., & Zehe, E., 2023. SciKit-GStat Uncertainty: A software extension to cope with uncertain geostatistical estimates. Spatial Statistics. https://doi.org/10.1016/j.spasta.2023.100737


